· Articles · 8 min read
Modelling Standardisation Series - 2 - Sensitivity Analysis
Resource estimation is a process that requires intensive geostatistics parameterization from the user (neighborhood, variogram models, domain cutoff, default density value, etc…). The value set for a given parameter is not always obvious and there is usually uncertainty around the “best” value to use (if one can define the ‘best’ as being the one that represents the most the data distribution, or minimize the economic risk, etc.). Each of these parameters has a more or less important influence on the final result and might increase or decrease the economical appreciation of the deposit.
A resource geologist has knowledge and intuition about how the parameters influence the final result and would use his/her experience to determine them: without actual study, these parameters are usually overestimated, under-estimated or simply ignored.
For instance, geologists and team principals may wonder what would be the impact of a 0.2 nugget effect versus 0.1 on the block model final reporting. Due to the interpretation bias of experimental variograms, no one can really tell whether the nugget effect should be at 0.1 or 0.2 and most importantly quantify the magnitude of its effect on results.
Fortunately, mathematical methods such as the Design of Experiments have been developed to explore the influence of parameters on a process as well as the uncertainties they cause on results. Getting a better idea of the relative importance of each parameter is not only a way to be more efficient but also to approach the model sensitivity through its uncertainties. Analyzing the parameter sensitivity is not straightforward especially when their effects are not independent.
DeepLime has therefore developed a Sensibility Analysis Python library that may be used for resource modeling or other processes such as pit optimization, flow simulation, etc.
A few words about Sensitivity Analysis (SA)
The sensitivity analysis helps understand the impact of the input parameters on the modeled output. When a model is so complex that the relationships between inputs and output are poorly understood, the SA allows estimating how the output - also called response - is affected by the input variables and ranking the input parameters by their magnitude of influence on the output. The SA is therefore useful for simplifying a large number of variable parameters down to a few, by setting input parameters that have no or very little effect on the output and by focusing on the most sensitive parameters.
To fully understand the influence and the combined effects of the input parameters, the simplest, yet ineffective, solution would be to test all possible combinations. This would clearly lead to extensive computation time for complex modeling processes that involve several input parameters. For instance, a modeling process with 5 parameters of 3 different candidate values for each parameter (e.g. low-medium-high possible values) leads to 243 possible run combinations. As one may encounter long modeling processes and/or with a higher number of parameters, it becomes largely impractical; two main approaches have therefore been developed to overcome it: the global approach and the local approach.
The first historical approach to SA is known as the local approach. One of the simplest and most intuitive of these approaches consist in changing One-Variable-At-a-Time (OVAT). The OVAT approach keeps all input factors set except one in order to evaluate the effect it produces on the output. Nevertheless, the OVAT approach cannot detect the presence of interactions between input variables and is unsuitable for non-linear models. To overcome the limitations of local methods, a new class of methods was developed in the late 1980s: the global methods. The global sensitivity analysis considers the whole range of variation on the input parameters and is performed with Designs Of Experiments (DoE). The DoE consists in selecting a particular subset of the runs in order to expose information about the most important features.
The Plackett-Burman design (1946) is an experimental design where each combination of levels for any pair of factors appears the same number of times, throughout all the experimental runs. Plackett and Burman used the method found in 1933 by Raymond Paley for generating orthogonal matrices whose elements are all either 1 or −1 corresponding to high and low levels of a variable. Thus, the Plackett-Burman design explores many more configurations than the OVAT method and requires no more than 4 runs more than the number of model parameters to be estimated: it is a significant reduction of the number of runs compared to all the possible combinations.
This process yields the magnitude of the impact of each parameter. One could go further by trying to estimate the uncertainties generated by these parameters on the output: to get a probabilistic distribution of the possible outcome from a DoE, the Response Surface Methodology (RSM) was introduced by Box and Wilson (1951) and further complemented by Box and Behnken (1960). It consists in finding a quadratic polynomial relationship between the output response and the input parameters. When combined with a Monte Carlo approach where each input parameter has its own probabilistic distribution (e.g. uniform, triangular, Gaussian, etc), extensive distribution of the response can be computed very quickly and the Probabilistic Distribution Function (PDF) can be generated from where significant percentiles (e.g. P10, P50, P90) can be extracted.
Example of application in mining
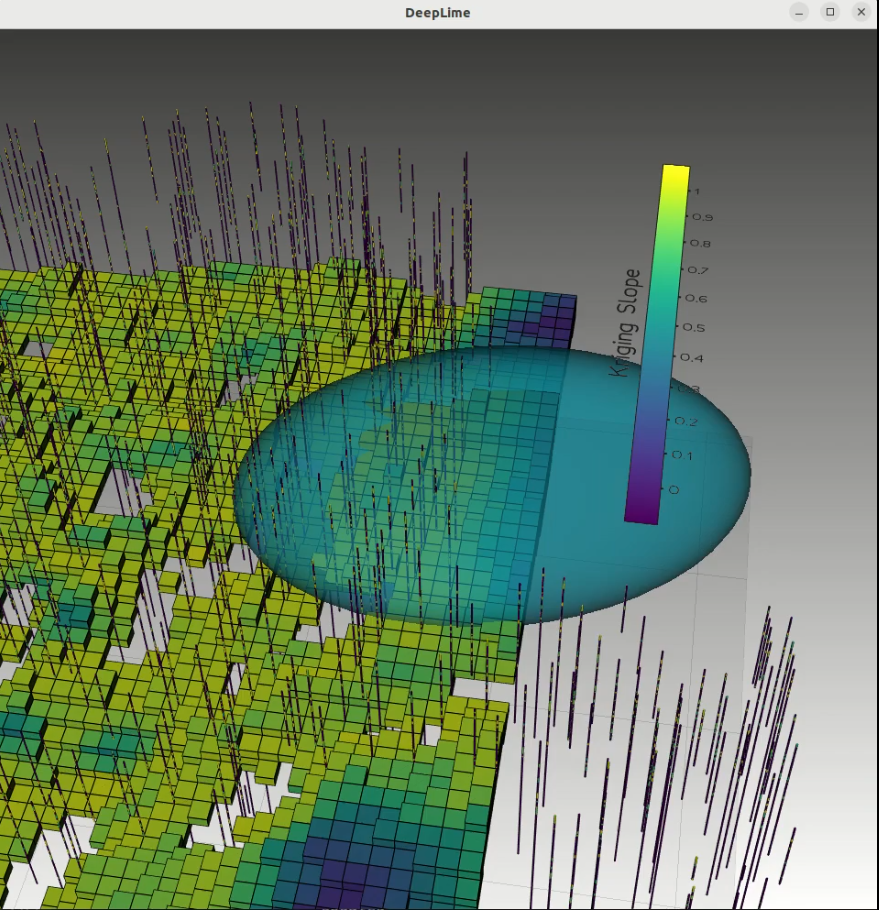
In the following example, we analyze the sensitivity of some classic parameters used in ordinary kriging. We would like to know how the tonnage, mean grade, and metal quantity above a specific cut-off are impacted by the common variogram parameters (nugget, ranges, anisotropies, etc). As the theoretical variogram model is usually inferred from the sampling data, the variogram parameters cannot be established with precision. It is a common practice to let the resource geologists set the variogram parameters according to their expertise and experience.
Considering the experimental variograms displayed below, we decided to use the following variogram model as a base case:
Depending on the resource geologist and the parameters used for the experimental variogram, the variogram model could be inferred with slightly different parameters, as exposed in the following
Table 1: Variogram model base case parameters
| Structure | Sill (in % to the standard deviation) | Range U | Range V | Range W |
|---|---|---|---|---|
| Nugget | 14% | N/A | N/A | N/A |
| Short Spherical | 63% | 16 | 10 | 15 |
| Long Spherical | 22% | 35 | 80 | 15 |
Depending on the resource geologist and the parameters used for the experimental variogram, the variogram model could be inferred with slightly different parameters, as exposed in the following table:
| Min value | Max Value | |
|---|---|---|
| Nugget Sill | 10% | 17% |
| Range U short spherical | 13 | 16 |
| Range V short spherical | 5 | 13 |
| Range W short spherical | 10 | 20 |
| Anisotropy rotation | 0 | 180 |
To keep this example simple, we will ignore the parameters related to the long spherical structure.
To understand the influence of the parameters, we compute the total metal quantity at a given cutoff, which we will call the ‘response’. Intuitively, one can say that if we modify the value of a given parameter, it will impact the metal quantity. The way the parameter will impact the metal quantity is highly dependent on the grade distribution (what is true for a deposit might not be true for another one).
An experienced resource geologist can guess the model sensitivity regarding some parameters (the nugget effect for example) but it might be a little bit harder when the effect is mixed with other variables.
There are some additional questions that might come to the resource geologist:
- Which parameters have no or very little impact?
- Which parameters have a significant impact?
- How to rank the parameters by the importance of impact?
- Which set of values gives the largest metal quantity?
- Which set of values gives the smallest metal quantity?
- Is the difference between the largest and smallest metal quantity a problem in the economic appraisal of the deposit?
- Given the allowed distribution for each parameter, what is the uncertainty of the total metal quantity?
- Is the set of parameters selected more optimistic or pessimistic?
Following the SA workflow described above using our Python sensitivity analysis module, here is an example of a tornado plot obtained: it compares the effects of each parameter with regard to the output metal quantity.
It suggests that the nugget effect value has the highest impact on the metal quantity above the cutoff compared to the other parameter. On the opposite, the vertical range (scale w) has the lowest impact on the metal quantity.
In addition to ranking the parameter by the magnitude of impact, the tornado plot also helps to understand whether the impact is positive (i-e the response value is greater, in blue) or negative (i-e the response value is lower, in pink). For instance, the bigger the nugget effect, the bigger the metal quantity whereas the bigger the vertical variogram and neighborhood scale, the lower the metal quantity.
At this point, one can apply the RSM + Monte Carlo approach to the most important parameters to get the probabilistic distribution of metal quantities given the possible distributions of input parameters.
The distribution shows the metal quantity can vary from 3 thousand to 32 thousand metal tons, nevertheless there are very few sets of parameters that would give such results given their low frequencies in the distribution. Looking at the quantiles, it indicates for instance that there is a 50% probability for the metal quantity to be between 14.54 and 19.33 ktons. Knowing the range of 50% probability of metal quantity is roughly 17 ktons +/- 2.5 ktons would not yield the same decisions if that range was 17 ktons +/- 10 ktons for instance.
Analyzing the Cumulative Distribution Function (CDF) could also yield key percentiles (probability to be above a certain tonnage) and produce answers to different economical questions.
Quantifying the actual impact of each parameter and the uncertainty they cause, allows us to make better-informed decisions and manage the risk accordingly. These analyses are often skipped in the mining industry although they are valuable: providing a module that drives experts through this process in a small amount of time is critical to bring these studies as part of regular workflows.