· Posts · 1 min read
Drillholes & Block Model Visualization on Map
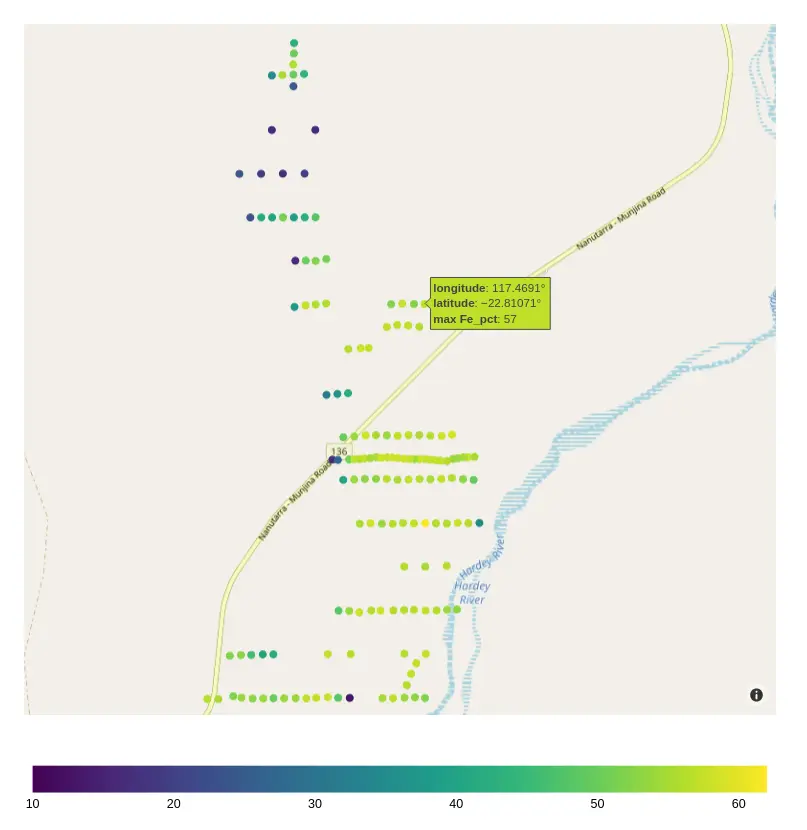
import geolime as geo
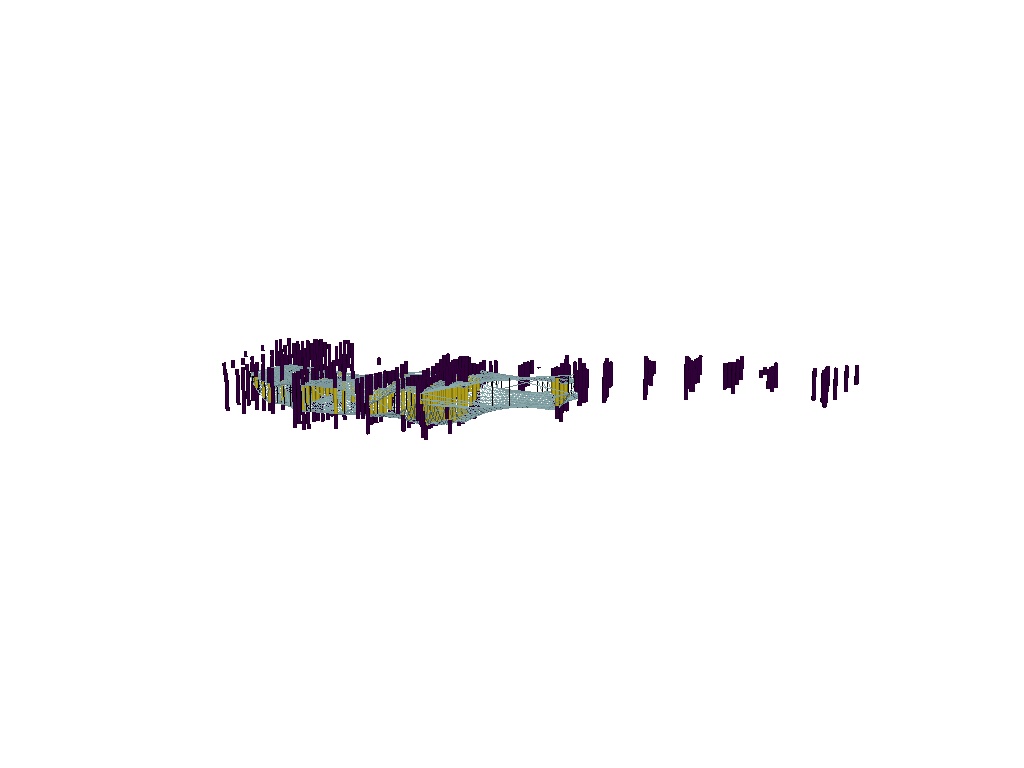
drillholes = geo.create_drillholes(
name='Rocklea',
collar,
hs_assay,
survey
)
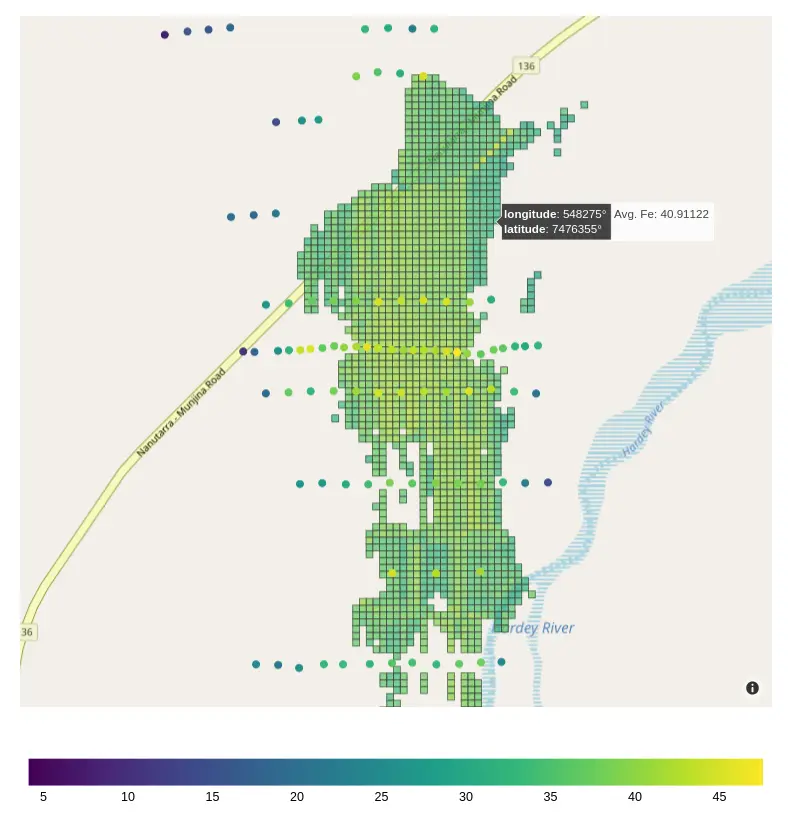
drillholes.to_map(
attribute='Fe_pct',
agg_method='max'
)
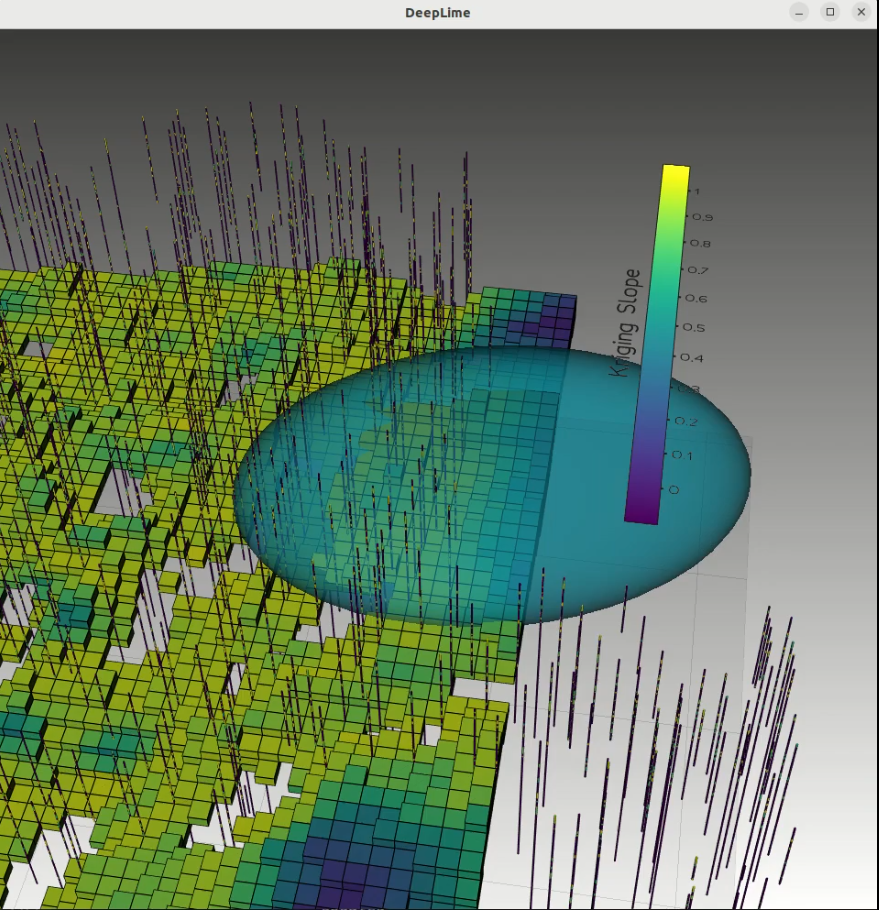
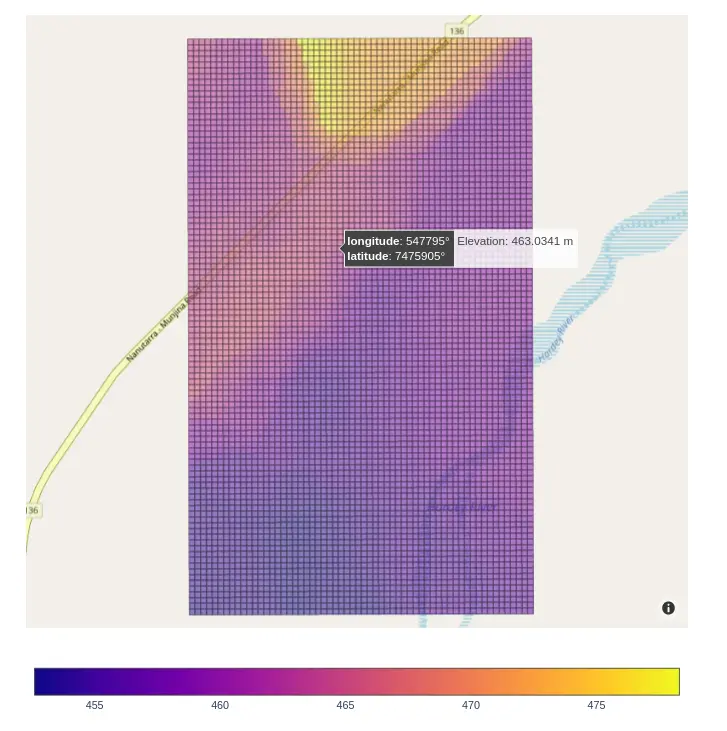
import geolime as geo

grid = geo.Voxel(
    name='Rocklea',
    shape=[60, 100, 10],
    origin=[547000,7474000,390],
    axis=[
        [30.,0.,0.,],
        [0.,30.,0.,],
        [0.,0.,10.,],
    ]
)
grid.to_map(
    attribute='Z',
    agg_method='max'
)
import geolime as geo

geo.to_map(
    [
        {
            "object": grid,
            "attribute"="Fe_pct",
            "agg_method"="mean",
            "region"="HighGrade"
        },
        {
            "object": drillholes,
            "attribute"="Fe_pct",
            "agg_method"="mean",
        }
    ]
)